|
Miltenyi Biotec
anti oct3 4  Anti Oct3 4, supplied by Miltenyi Biotec, used in various techniques. Bioz Stars score: 94/100, based on 1 PubMed citations. ZERO BIAS - scores, article reviews, protocol conditions and more https://www.bioz.com/result/anti oct3 4/product/Miltenyi Biotec Average 94 stars, based on 1 article reviews
anti oct3 4 - by Bioz Stars,
2026-02
94/100 stars
|
Buy from Supplier |
|
R&D Systems
goat polyclonal oct3 4  Goat Polyclonal Oct3 4, supplied by R&D Systems, used in various techniques. Bioz Stars score: 94/100, based on 1 PubMed citations. ZERO BIAS - scores, article reviews, protocol conditions and more https://www.bioz.com/result/goat polyclonal oct3 4/product/R&D Systems Average 94 stars, based on 1 article reviews
goat polyclonal oct3 4 - by Bioz Stars,
2026-02
94/100 stars
|
Buy from Supplier |
|
Addgene inc
human oct4 gene Human Oct4 Gene, supplied by Addgene inc, used in various techniques. Bioz Stars score: 93/100, based on 1 PubMed citations. ZERO BIAS - scores, article reviews, protocol conditions and more https://www.bioz.com/result/human oct4 gene/product/Addgene inc Average 93 stars, based on 1 article reviews
human oct4 gene - by Bioz Stars,
2026-02
93/100 stars
|
Buy from Supplier |
|
Addgene inc
human oct3 4 shrna against tp53 Human Oct3 4 Shrna Against Tp53, supplied by Addgene inc, used in various techniques. Bioz Stars score: 96/100, based on 1 PubMed citations. ZERO BIAS - scores, article reviews, protocol conditions and more https://www.bioz.com/result/human oct3 4 shrna against tp53/product/Addgene inc Average 96 stars, based on 1 article reviews
human oct3 4 shrna against tp53 - by Bioz Stars,
2026-02
96/100 stars
|
Buy from Supplier |
|
Addgene inc
human oct3 Human Oct3, supplied by Addgene inc, used in various techniques. Bioz Stars score: 93/100, based on 1 PubMed citations. ZERO BIAS - scores, article reviews, protocol conditions and more https://www.bioz.com/result/human oct3/product/Addgene inc Average 93 stars, based on 1 article reviews
human oct3 - by Bioz Stars,
2026-02
93/100 stars
|
Buy from Supplier |
|
Addgene inc
oct4 de luciferase plasmid Oct4 De Luciferase Plasmid, supplied by Addgene inc, used in various techniques. Bioz Stars score: 92/100, based on 1 PubMed citations. ZERO BIAS - scores, article reviews, protocol conditions and more https://www.bioz.com/result/oct4 de luciferase plasmid/product/Addgene inc Average 92 stars, based on 1 article reviews
oct4 de luciferase plasmid - by Bioz Stars,
2026-02
92/100 stars
|
Buy from Supplier |
|
Addgene inc
vectors expressed oct4 Vectors Expressed Oct4, supplied by Addgene inc, used in various techniques. Bioz Stars score: 94/100, based on 1 PubMed citations. ZERO BIAS - scores, article reviews, protocol conditions and more https://www.bioz.com/result/vectors expressed oct4/product/Addgene inc Average 94 stars, based on 1 article reviews
vectors expressed oct4 - by Bioz Stars,
2026-02
94/100 stars
|
Buy from Supplier |
|
Addgene inc
human oct4 Human Oct4, supplied by Addgene inc, used in various techniques. Bioz Stars score: 93/100, based on 1 PubMed citations. ZERO BIAS - scores, article reviews, protocol conditions and more https://www.bioz.com/result/human oct4/product/Addgene inc Average 93 stars, based on 1 article reviews
human oct4 - by Bioz Stars,
2026-02
93/100 stars
|
Buy from Supplier |
|
Addgene inc
oct4  Oct4, supplied by Addgene inc, used in various techniques. Bioz Stars score: 93/100, based on 1 PubMed citations. ZERO BIAS - scores, article reviews, protocol conditions and more https://www.bioz.com/result/oct4/product/Addgene inc Average 93 stars, based on 1 article reviews
oct4 - by Bioz Stars,
2026-02
93/100 stars
|
Buy from Supplier |
|
Santa Cruz Biotechnology
anti oct4 pou5f1 antibody  Anti Oct4 Pou5f1 Antibody, supplied by Santa Cruz Biotechnology, used in various techniques. Bioz Stars score: 96/100, based on 1 PubMed citations. ZERO BIAS - scores, article reviews, protocol conditions and more https://www.bioz.com/result/anti oct4 pou5f1 antibody/product/Santa Cruz Biotechnology Average 96 stars, based on 1 article reviews
anti oct4 pou5f1 antibody - by Bioz Stars,
2026-02
96/100 stars
|
Buy from Supplier |
|
Addgene inc
episomal factors oct4  Episomal Factors Oct4, supplied by Addgene inc, used in various techniques. Bioz Stars score: 90/100, based on 1 PubMed citations. ZERO BIAS - scores, article reviews, protocol conditions and more https://www.bioz.com/result/episomal factors oct4/product/Addgene inc Average 90 stars, based on 1 article reviews
episomal factors oct4 - by Bioz Stars,
2026-02
90/100 stars
|
Buy from Supplier |
|
Addgene inc
mouse oct4 Mouse Oct4, supplied by Addgene inc, used in various techniques. Bioz Stars score: 92/100, based on 1 PubMed citations. ZERO BIAS - scores, article reviews, protocol conditions and more https://www.bioz.com/result/mouse oct4/product/Addgene inc Average 92 stars, based on 1 article reviews
mouse oct4 - by Bioz Stars,
2026-02
92/100 stars
|
Buy from Supplier |
Image Search Results
Journal: Cell reports
Article Title: TP53 promotes lineage commitment of human embryonic stem cells through ciliogenesis and sonic hedgehog signaling
doi: 10.1016/j.celrep.2022.110395
Figure Lengend Snippet: KEY RESOURCES TABLE
Article Snippet: For flow cytometry, hESCs were fixed with 2-4% PFA, permeabilized with methanol, and then stained with anti-SOX2 (APC; Miltenyi Biotec),
Techniques: Recombinant, Staining, Plasmid Preparation, Selection, DNA HS Assay, CRISPR, Software, Imaging, Inverted Microscopy, Microscopy, Flow Cytometry
Journal: bioRxiv
Article Title: Transgene-Free Ex Utero Derivation of A Human Post-Implantation Embryo Model Solely from Genetically Unmodified Naïve PSCs
doi: 10.1101/2023.06.14.544922
Figure Lengend Snippet: a, left, scheme of the tested induction (iGATA4, iGATA6, iCDX2, iGATA3) and media conditions for generating the three different needed extraembryonic lineages from naïve pluripotent stem cells (nPSC). Right, scheme of the early human post-implantation embryo with the epiblast (cyan), hypoblast (yellow), ExEM (grey), and trophoblast (magenta) compartments. b, Flow Cytometry (FACS) plots of PDGFRa-APC versus SSC for PrE/ExEM induction using iGATA4 with DOX in HENSM after 6 days (right) and the control condition of naïve cells (WT cells without iGATA4, left). c, from left to right, FACS plots of PDGFRa-APC for PrE/ExEM induction using iGATA4 and iGATA6 with DOX for 6 days in different media conditions as indicated (C10F4PDGF, RACL, RCL). d, from left to right, FACS plots of PDGFRa-APC for PrE/ExEM using WT naïve PSCs induced 6 days in different media conditions (N2B27, RCL, and RCL for 3 days followed by 3 days of N2B27). e, immunofluorescence images of WT nPSCs induced in RCL media for SOX17 (yellow) and BST2 (red). Two distinct cell populations emerge with mutually exclusive expression pattern (outlined); scale bar, 100 µm. f, FACS plots of ENPEP against TACSTD2 for trophectoderm (TE) lineage induction of HENSM naïve PSCs in BAP(J) regimen for 3 days. g, immunofluorescence images of day 6 SEM aggregates stained for OCT4 (cyan), SOX17 (yellow) and SDC1 (magenta). Aggregates made with iGATA3 in DOX for 72h in BAP(J), showed no outer surrounding trophoblasts in the obtained aggregates (left). In contrast, WT nPSCs in BAP(J) showed very high efficiency in yielding aggregates with outer layer of surrounding trophoblast (marked by SDC1 – magenta). Scale bars 100 µm. RACL R PMI based medium with C HIR99021, ACTIVIN, and L IF; RCL, R PMI based medium with C HIR99021 and L IF without ACTIVIN; H ENSM, H uman E nhanced N aïve S tem cell M edia; BAP(J), DMEM/F12 based medium with ALK4/5/7 inhibitor A 83-01, ERKi/MEKi PD0325901, and B MP4 substituted with J AK inhibitor I after 24h.
Article Snippet: The antibodies and dilutions employed for cell immunofluorescence were the following: Rabbit polyclonal anti-Cdx2 (Cell Signaling Cat# 3977) 1:200; Mouse monoclonal anti-Cdx2 (Biogenex Cat# MU392A-UC) 1:200; Rabbit polyclonal anti Gata4 (Abcam Cat# Ab84593) 1:120; Rabbit monoclonal anti-Foxa2 (Abcam Cat# Ab108422) 1:100; Goat polyclonal anti-Sox17 (R&D Cat# AF1924) 1:200; Mouse monoclonal anti-Oct4 (clone C-10) (Santa Cruz Cat# SC-5279) 1:200; Rabbit monoclonal Cdx2 (Abcam Cat# ab76541) 1:200; Goat Monoclonal Tfap2c (R&D Cat# AF5059) 1:200; Rabbit monoclonal Cytokeratin 7 (Abcam Cat# ab181598) 1:200; Rabbit monoclonal Cytokeratin 7 (Abcam Cat# ab68459) 1:200; Rabbit monoclonal Nanog (Abcam Cat# ab109250) 1:200; Mouse monoclonal Gata3 (Invitrogen Cat# MA1-028) 1:200; Goat polyclonal Gata3 (R&D Cat# AF2605) 1:200; Mouse monoclonal HCG-Beta (Abcam Cat# ab9582) 1:200; Rabbit monoclonal Gata6 (Cell signaling Cat# 5951) 1:200;
Techniques: Flow Cytometry, Immunofluorescence, Expressing, Staining

Journal: bioRxiv
Article Title: Transgene-Free Ex Utero Derivation of A Human Post-Implantation Embryo Model Solely from Genetically Unmodified Naïve PSCs
doi: 10.1101/2023.06.14.544922
Figure Lengend Snippet: a , anatomical sections taken from the Carnegie collection and schemes of the human embryo development between 7 and 14 days post-fertilization (dpf); left to right, Carnegie Stages (CS) CS5a (7-8 dpf), CS5b (9-10 dpf), CS5c (11-12 dpf), and CS6a (13-14 dpf). b , scheme of the protocol for generating human early post-implantation SEMs. Hypoblast/ExEM (yellow/grey), epiblast (cyan), and trophoblast (magenta) lineage priming for 3 days from naïve hPSCs in HENSM media is followed by aggregation (counted as day 0) in Aggrewell 400 at the 1:1:3 nPSC: PrE/ExEM: TE ratio in N2B27. Starting from day 3, SEMs are transferred to non-adherent 6-well plates on a shaker and cultured in Ex-Utero Culture Medium 2 (EUCM2) with increasing concentrations of FBS until day 8 (see Methods). c , representative brightfield images of SEMs growing between days 0 and 8 showing formation of the inner embryonic structures, which were defined based on the lineage-specific immunofluorescence (see ). Scale was maintained to show the growth. d , from left to right, immunofluorescence images of SEMs from days 4, 6, and 8 of the protocol, showing OCT4 (cyan), SOX17 (yellow), CK7 (magenta), and nuclei (DAPI, white), labeling different embryonic structures (marked with arrows). e , quantification of the SEM derivation efficiency across three independent experimental replicates. f , 3D reconstruction of the day 8 SEM shown in d (right) with segmented epiblast, (OCT4, cyan), hypoblast (SOX17, yellow), CK7 (magenta) and nuclei (DAPI). Bottom, segmentation of the epiblast and hypoblast shown in 0 and 90 0 degrees of rotation. See also Video S1. Epi, epiblast; AC, amniotic cavity; Am, amnion; TE, trophectoderm; Tb, trophoblast; PrE, primitive endoderm; Hb, hypoblast; PYS, primary yolk sac; VE, visceral endoderm; PE, parietal endoderm; SYS, secondary yolk sac; ExEM, extraembryonic mesoderm; ChC, chorionic cavity; Sk, stalk; L, lacunae. Scale bars, 50 µm.
Article Snippet: The antibodies and dilutions employed for cell immunofluorescence were the following: Rabbit polyclonal anti-Cdx2 (Cell Signaling Cat# 3977) 1:200; Mouse monoclonal anti-Cdx2 (Biogenex Cat# MU392A-UC) 1:200; Rabbit polyclonal anti Gata4 (Abcam Cat# Ab84593) 1:120; Rabbit monoclonal anti-Foxa2 (Abcam Cat# Ab108422) 1:100; Goat polyclonal anti-Sox17 (R&D Cat# AF1924) 1:200; Mouse monoclonal anti-Oct4 (clone C-10) (Santa Cruz Cat# SC-5279) 1:200; Rabbit monoclonal Cdx2 (Abcam Cat# ab76541) 1:200; Goat Monoclonal Tfap2c (R&D Cat# AF5059) 1:200; Rabbit monoclonal Cytokeratin 7 (Abcam Cat# ab181598) 1:200; Rabbit monoclonal Cytokeratin 7 (Abcam Cat# ab68459) 1:200; Rabbit monoclonal Nanog (Abcam Cat# ab109250) 1:200; Mouse monoclonal Gata3 (Invitrogen Cat# MA1-028) 1:200; Goat polyclonal Gata3 (R&D Cat# AF2605) 1:200; Mouse monoclonal HCG-Beta (Abcam Cat# ab9582) 1:200; Rabbit monoclonal Gata6 (Cell signaling Cat# 5951) 1:200;
Techniques: Cell Culture, Immunofluorescence, Labeling

Journal: bioRxiv
Article Title: Transgene-Free Ex Utero Derivation of A Human Post-Implantation Embryo Model Solely from Genetically Unmodified Naïve PSCs
doi: 10.1101/2023.06.14.544922
Figure Lengend Snippet: a, relative proportion of the indicated cell types among extra-embryonic cells of mouse natural embryos grown in utero or ex utero and in day 8 mouse SEMs generated from iCdx2 mouse naïve ESCs (and not embryo derived mouse TSC lines) . Three pooled samples are presented: in utero natural embryos (n = 2401 cells), ex utero natural embryos (n = 1382), and mouse iCdx2 day 8 SEMs (n = 6249). The cell types: Chorion, Intermediate-Chorion, Chorion Progenitors, Uncommitted Ectoplacental-Cone Cells (EPC), Trophoblast Giant Cells (TGC) progenitors, parietal trophoblast giant cells (pTGC), spiral artery associated trophoblast giant cells (SpA-TGC), and junctional zone spongiotrophoblast cells (SpT-Gly) based on previously published similar analysis and annotations . b , frequencies of the cell types presented in (a) , showing a significant reduction of TGC-progenitors and pTGCs in ex utero embryos (natural and SEM), compared to in utero embryos. Shaded area represents 95% confidence interval. This analysis confirmed that naïve PSCs derived TSC lineage following Cdx2 overexpression under optimized conditions developed in , can contribute to both the chorionic and ectoplacental cone lineages in mouse SEMs generated exclusively from mouse naïve PSCs. c, scheme of the donor plasmid vector used for genomic integration of the DOX-inducible CDX2 overexpression in human PSCs. d , immunofluorescence images of iCDX2 cells, showing CDX2 (green) expression only in response to DOX; nuclei (DAPI, blue). Scale bars, 50 µm. e , images of iCDX2 (left) and WT (right) human W3 ESCs in HENSM conditions, showing live fluorescence of tdTomato (red) after transfection with lentiviral particles carrying the fluorophore. Scale bars, 50 µm. f , top, the scheme of the experiment, where naïve PSCs and Hypoblast/ExEM induced cells were aggregated with iCDX2 cells, induced by DOX for 48h in three different media, PALY (N2B27 supplemented with P D0325901, A 83-01, h L IF, and Y -27632) , TSCm , and BAP(J) (DMEM/F12 based medium with ALK4/5/7 inhibitor A83-01, FGF2 inhibitor P D0325901, and BMP4 substituted with JAK inhibitor I after 24h). f , bottom, immunofluorescence images showing no surrounding trophoblast in aggregates with iCDX2 cells, regardless of the media conditions; epiblast (OCT4, cyan), hypoblast (GATA4, SOX17, yellow), trophoblast (CK7, SDC1, magenta), nuclei (DAPI, blue). Scale bars (from left to right), 100 µm, 100 µm, 50 µm. g , RT-qPCR gene expression (normalized by GAPDH and ACTIN) of iCDX2 (blue) and WT (red) cells in TSCm conditions for one, three, and six days versus naïve PSCs maintained in HENSM conditions and used as a reference control (white). h , top, the scheme of the experiment, in which naïve PSCs and Hypoblast/ExEM induced cells were aggregated with WT or iCDX2 tdTomato-labelled nPSC induced towards trophectoderm (TE) in PALY media with or without DOX as indicated. h, bottom, brightfield and live fluorescence images of day 4 – 7 aggregates showing localization of the trophoblast. Scale bar, 200 µm. i , Phase contrast microscopy images showing iCDX2 cells induced for 72h in different media (HENSM, BAP(J), TSCm) with or without DOX, showing reduced viability upon iCDX2 transgene overexpression. In all conditions, 750,000 iCDX2 cells were seeded in 10 cm Matrigel coated plates, and DOX induction was started 24h after seeding. Scale bar, 100 µm.
Article Snippet: The antibodies and dilutions employed for cell immunofluorescence were the following: Rabbit polyclonal anti-Cdx2 (Cell Signaling Cat# 3977) 1:200; Mouse monoclonal anti-Cdx2 (Biogenex Cat# MU392A-UC) 1:200; Rabbit polyclonal anti Gata4 (Abcam Cat# Ab84593) 1:120; Rabbit monoclonal anti-Foxa2 (Abcam Cat# Ab108422) 1:100; Goat polyclonal anti-Sox17 (R&D Cat# AF1924) 1:200; Mouse monoclonal anti-Oct4 (clone C-10) (Santa Cruz Cat# SC-5279) 1:200; Rabbit monoclonal Cdx2 (Abcam Cat# ab76541) 1:200; Goat Monoclonal Tfap2c (R&D Cat# AF5059) 1:200; Rabbit monoclonal Cytokeratin 7 (Abcam Cat# ab181598) 1:200; Rabbit monoclonal Cytokeratin 7 (Abcam Cat# ab68459) 1:200; Rabbit monoclonal Nanog (Abcam Cat# ab109250) 1:200; Mouse monoclonal Gata3 (Invitrogen Cat# MA1-028) 1:200; Goat polyclonal Gata3 (R&D Cat# AF2605) 1:200; Mouse monoclonal HCG-Beta (Abcam Cat# ab9582) 1:200; Rabbit monoclonal Gata6 (Cell signaling Cat# 5951) 1:200;
Techniques: In Utero, Generated, Derivative Assay, Over Expression, Plasmid Preparation, Immunofluorescence, Expressing, Fluorescence, Transfection, Quantitative RT-PCR, Microscopy

Journal: bioRxiv
Article Title: Transgene-Free Ex Utero Derivation of A Human Post-Implantation Embryo Model Solely from Genetically Unmodified Naïve PSCs
doi: 10.1101/2023.06.14.544922
Figure Lengend Snippet: a , scheme depicting aggregation protocol of epiblast (naïve hPSCs in HENSM media) and PrE/ExEM cells with tdTomato-expressing validated human TSC line derived from human primed ESCs (termed pTSC). b , brightfield images and live fluorescence of tdTomato (red) in aggregates with labeled TSCs; scale bar, 200 µm. Right, zoom into the several SEMs with tdTomato signal. Scale bar, 50 µm. The aggregates with TSCs do not form a uniformly surrounding TB layer, but rather remain as isolated clumps. c , immunofluorescence images of day 8 aggregates, showing OCT4 (cyan), SDC1 (magenta), and TSCs, labelled by tdTomato; nuclei (DAPI, white). Scale bar, 50 µm. White arrows highlight TSC isolated clumps. d , sequential aggregation of nPSCs (in HENSM) with tdTomato-expressing primed PSC derived TSC line on the first or second days of the aggregation protocol. e , brightfield images and live fluorescence of tdTomato (red) in day 5 and 8 aggregates with TSCs, added on the first (top) or second (bottom) days of aggregation; scale bar, 200 µm. Right, zoom into the several SEMs with tdTomato signal. Scale bar, 50 µm. The aggregates with TSCs do not form a uniformly surrounding TB layer, but rather remain as isolated clumps.
Article Snippet: The antibodies and dilutions employed for cell immunofluorescence were the following: Rabbit polyclonal anti-Cdx2 (Cell Signaling Cat# 3977) 1:200; Mouse monoclonal anti-Cdx2 (Biogenex Cat# MU392A-UC) 1:200; Rabbit polyclonal anti Gata4 (Abcam Cat# Ab84593) 1:120; Rabbit monoclonal anti-Foxa2 (Abcam Cat# Ab108422) 1:100; Goat polyclonal anti-Sox17 (R&D Cat# AF1924) 1:200; Mouse monoclonal anti-Oct4 (clone C-10) (Santa Cruz Cat# SC-5279) 1:200; Rabbit monoclonal Cdx2 (Abcam Cat# ab76541) 1:200; Goat Monoclonal Tfap2c (R&D Cat# AF5059) 1:200; Rabbit monoclonal Cytokeratin 7 (Abcam Cat# ab181598) 1:200; Rabbit monoclonal Cytokeratin 7 (Abcam Cat# ab68459) 1:200; Rabbit monoclonal Nanog (Abcam Cat# ab109250) 1:200; Mouse monoclonal Gata3 (Invitrogen Cat# MA1-028) 1:200; Goat polyclonal Gata3 (R&D Cat# AF2605) 1:200; Mouse monoclonal HCG-Beta (Abcam Cat# ab9582) 1:200; Rabbit monoclonal Gata6 (Cell signaling Cat# 5951) 1:200;
Techniques: Expressing, Derivative Assay, Fluorescence, Labeling, Isolation, Immunofluorescence
Journal: bioRxiv
Article Title: Transgene-Free Ex Utero Derivation of A Human Post-Implantation Embryo Model Solely from Genetically Unmodified Naïve PSCs
doi: 10.1101/2023.06.14.544922
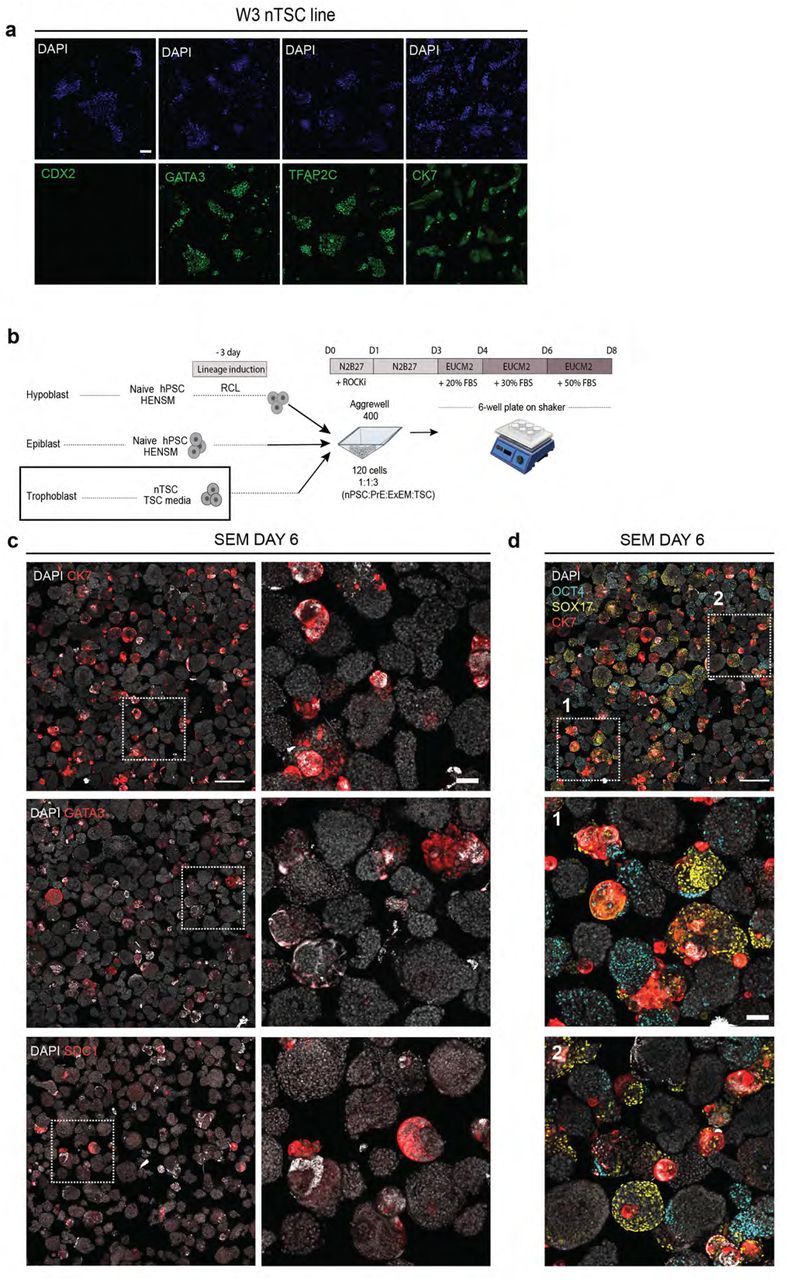
Figure Lengend Snippet: a, immunofluorescence images validating correct expression of TSC marker genes in colonies of a WIBR3 (W3) naïve hESC derived TSC line (termed nTSC). CK7, TFAP2C, GATA3, CDX2 (all in green); DAPI (blue). Scale bar, 100 µm. b, scheme for aggregation protocol of naïve pluripotent stem cells (nPSCs) in HENSM media, naïve-derived trophoblast stem cells (nTSCs), and nPSCs induced in RCL towards PrE/ExEM for 3 days. c , immunofluorescence images showing rare expression of CK7, GATA3, and SDC1 (red) trophoblast markers in the aggregates. nuclei (DAPI, white); Left column scale bar, 500 µm; Right, zoom into several aggregates with CK7 expression; scale bar, 100 µm. d , immunofluorescence image from (upper left panel in c) , showing Epi (OCT4, cyan) and PrE (SOX17, yellow) with CK7 (red); nuclei (DAPI, white). Zoom ins from the indicated regions are shown. Although some aggregates express lineage markers, they do not organize into embryoid-like structures and are not uniformly surrounded by the trophoblast compartment. Scale bar, 500 µm; bottom, 100 µm.
Article Snippet: The antibodies and dilutions employed for cell immunofluorescence were the following: Rabbit polyclonal anti-Cdx2 (Cell Signaling Cat# 3977) 1:200; Mouse monoclonal anti-Cdx2 (Biogenex Cat# MU392A-UC) 1:200; Rabbit polyclonal anti Gata4 (Abcam Cat# Ab84593) 1:120; Rabbit monoclonal anti-Foxa2 (Abcam Cat# Ab108422) 1:100; Goat polyclonal anti-Sox17 (R&D Cat# AF1924) 1:200; Mouse monoclonal anti-Oct4 (clone C-10) (Santa Cruz Cat# SC-5279) 1:200; Rabbit monoclonal Cdx2 (Abcam Cat# ab76541) 1:200; Goat Monoclonal Tfap2c (R&D Cat# AF5059) 1:200; Rabbit monoclonal Cytokeratin 7 (Abcam Cat# ab181598) 1:200; Rabbit monoclonal Cytokeratin 7 (Abcam Cat# ab68459) 1:200; Rabbit monoclonal Nanog (Abcam Cat# ab109250) 1:200; Mouse monoclonal Gata3 (Invitrogen Cat# MA1-028) 1:200; Goat polyclonal Gata3 (R&D Cat# AF2605) 1:200; Mouse monoclonal HCG-Beta (Abcam Cat# ab9582) 1:200; Rabbit monoclonal Gata6 (Cell signaling Cat# 5951) 1:200;
Techniques: Immunofluorescence, Expressing, Marker, Derivative Assay

Journal: bioRxiv
Article Title: Transgene-Free Ex Utero Derivation of A Human Post-Implantation Embryo Model Solely from Genetically Unmodified Naïve PSCs
doi: 10.1101/2023.06.14.544922
Figure Lengend Snippet: a , scheme of the protocol: induced PrE/ExEM cells (yellow), WT naive pluripotent stem cells (nPSCs) maintained in HENSM medium (cyan), and WT nPSC induced towards trophoblast with BAP(J) medium (magenta) were aggregated on Aggrewell 400 platform at different ratios in N2B27 and grown as indicated in the scheme until day 6. b , left, brightfield images of day 6 SEMs, aggregated from total 60 cells at 1:1:3 (nPSC: PrE/ExEM: TE) cell ratio, showing mostly small and fragmented aggregates. Right, brightfield images of day 6 SEMs, aggregated from total 120 cells at 1:1:3 (nPSC: PrE/ExEM: TE) cell ratio, showing lower fragmentation tendency and more frequent formation of bigger aggregates (this condition was chosen for SEM generation). Scale bar, 1000 µm; zoom, 125 µm. c , immunofluorescence images of day 6 SEMs showing epiblast (OCT4, cyan), hypoblast (SOX17, yellow), and trophoblast (SDC1, magenta); nuclei (DAPI, white). Left, Day 6 SEMs aggregated from total 132 cells at 4:2:7 (nPSC: PrE/ExEM :TE) cell ratio, or, right, from total 160 cells at 2:1:5 (nPSC: PrE/ExEM :TE) cell ratio showing inadequate organization of SEMs, when compared to optimized conditions (120 cells at 1:1:3 nPSC: PrE/ExEM: TE) as shown in . Scale bars, 100 µm. d , left, scheme of the experiment testing the capacity of cells, differentiated from human WIBR3 primed PSCs, to form equivalent SEMs to those obtained from isogenic naïve PSCs expanded in HENSM conditions. Right, immunofluorescence images of day 6 SEMs showing OCT4 (cyan), SOX17 (yellow), CK7 (magenta), and nuclei (DAPI, white). Scale bar, 200 µm. The resulting aggregates when starting with isogenic primed PSCs, did not present organization and maturation of the key embryonic and extra-embryonic compartments a seen when starting with naïve PSCs (please compare to ).
Article Snippet: The antibodies and dilutions employed for cell immunofluorescence were the following: Rabbit polyclonal anti-Cdx2 (Cell Signaling Cat# 3977) 1:200; Mouse monoclonal anti-Cdx2 (Biogenex Cat# MU392A-UC) 1:200; Rabbit polyclonal anti Gata4 (Abcam Cat# Ab84593) 1:120; Rabbit monoclonal anti-Foxa2 (Abcam Cat# Ab108422) 1:100; Goat polyclonal anti-Sox17 (R&D Cat# AF1924) 1:200; Mouse monoclonal anti-Oct4 (clone C-10) (Santa Cruz Cat# SC-5279) 1:200; Rabbit monoclonal Cdx2 (Abcam Cat# ab76541) 1:200; Goat Monoclonal Tfap2c (R&D Cat# AF5059) 1:200; Rabbit monoclonal Cytokeratin 7 (Abcam Cat# ab181598) 1:200; Rabbit monoclonal Cytokeratin 7 (Abcam Cat# ab68459) 1:200; Rabbit monoclonal Nanog (Abcam Cat# ab109250) 1:200; Mouse monoclonal Gata3 (Invitrogen Cat# MA1-028) 1:200; Goat polyclonal Gata3 (R&D Cat# AF2605) 1:200; Mouse monoclonal HCG-Beta (Abcam Cat# ab9582) 1:200; Rabbit monoclonal Gata6 (Cell signaling Cat# 5951) 1:200;
Techniques: Immunofluorescence

Journal: bioRxiv
Article Title: Transgene-Free Ex Utero Derivation of A Human Post-Implantation Embryo Model Solely from Genetically Unmodified Naïve PSCs
doi: 10.1101/2023.06.14.544922
Figure Lengend Snippet: a , brightfield images of day 2 SEM aggregates inside the Aggrewell 400 plate; addition of BSA to the aggregation medium prevents attachment of the aggregates to the plate edges (white arrows). Scale bar, 400 µm. Optimal BSA concentration chosen for further experimentation highlighted by a green box. b , growth of SEMs in 6-well non-adherent plates without shaking leads to their attachment to the plate and disruption of morphology. Scale bar, 200 µm. c , scheme of the experiment in which volume of the culture media on the non-adherent 6-well dish, using orbital shaking (day 4-8), was optimized. d , brightfield images of multiple SEMs showing that the rate of their clumping with each other is dependent on the media volume (1 – 6 ml). The optimal suspension condition is outlined in green (3ml). Scale bar, 200 µm. e , top, the scheme of roller culture test, where aggregates were generated as described (see Methods), cultured until day 6 on a shaker, followed by roller culture in EUCM2 50% FBS 20%O 2 5%CO2. Bottom, immunofluorescence images of day 7 SEMs in this regimen, showing Epi (OCT4, cyan), hypoblast (SOX17, yellow), and trophoblast (CK7, magenta); nuclei (DAPI, white), brightfield (BF); scale bar, 200 µm. Right, example of the SEM in which epiblast, hypoblast, and trophoblast are adequately compartmentalized; scale bar, 50 µm.
Article Snippet: The antibodies and dilutions employed for cell immunofluorescence were the following: Rabbit polyclonal anti-Cdx2 (Cell Signaling Cat# 3977) 1:200; Mouse monoclonal anti-Cdx2 (Biogenex Cat# MU392A-UC) 1:200; Rabbit polyclonal anti Gata4 (Abcam Cat# Ab84593) 1:120; Rabbit monoclonal anti-Foxa2 (Abcam Cat# Ab108422) 1:100; Goat polyclonal anti-Sox17 (R&D Cat# AF1924) 1:200; Mouse monoclonal anti-Oct4 (clone C-10) (Santa Cruz Cat# SC-5279) 1:200; Rabbit monoclonal Cdx2 (Abcam Cat# ab76541) 1:200; Goat Monoclonal Tfap2c (R&D Cat# AF5059) 1:200; Rabbit monoclonal Cytokeratin 7 (Abcam Cat# ab181598) 1:200; Rabbit monoclonal Cytokeratin 7 (Abcam Cat# ab68459) 1:200; Rabbit monoclonal Nanog (Abcam Cat# ab109250) 1:200; Mouse monoclonal Gata3 (Invitrogen Cat# MA1-028) 1:200; Goat polyclonal Gata3 (R&D Cat# AF2605) 1:200; Mouse monoclonal HCG-Beta (Abcam Cat# ab9582) 1:200; Rabbit monoclonal Gata6 (Cell signaling Cat# 5951) 1:200;
Techniques: Concentration Assay, Generated, Cell Culture, Immunofluorescence

Journal: bioRxiv
Article Title: Transgene-Free Ex Utero Derivation of A Human Post-Implantation Embryo Model Solely from Genetically Unmodified Naïve PSCs
doi: 10.1101/2023.06.14.544922
Figure Lengend Snippet: a , from left to right, representative merged brightfield (BF) and immunofluorescence images of day 3 SEMs showing three lineages, epiblast (OCT4, cyan), hypoblast (SOX17, yellow), and trophoblast (SCD1, magenta) merged with a nuclei channel (DAPI, white). b , representative merged brightfield and immunofluorescence images of multiple day 6 SEMs, showing epiblast (OCT4, cyan), hypoblast (SOX17, yellow), and trophoblast (CK7, magenta) merged with a nuclei channel (DAPI, white). c , immunofluorescence images of day 6 SEMs with segregated Epi (OCT4, cyan) and hypoblast (SOX17, yellow), and surrounded by trophoblast (CK7, magenta, outlined). Left panel shows a wide field image to identify adequate structures (dotted square). Right panel zooms into the structure of interest d , immunofluorescence images of common examples of mis-developed day 6 SEMs with no trophoblast (1), or no epiblast and hypoblast (2), or no epiblast (3). Epiblast (OCT4, cyan), hypoblast (SOX17, yellow), and trophoblast (SDC1, magenta); nuclei (DAPI, white). Scale bars, 50 µm, 200 µm (c right, d right).
Article Snippet: The antibodies and dilutions employed for cell immunofluorescence were the following: Rabbit polyclonal anti-Cdx2 (Cell Signaling Cat# 3977) 1:200; Mouse monoclonal anti-Cdx2 (Biogenex Cat# MU392A-UC) 1:200; Rabbit polyclonal anti Gata4 (Abcam Cat# Ab84593) 1:120; Rabbit monoclonal anti-Foxa2 (Abcam Cat# Ab108422) 1:100; Goat polyclonal anti-Sox17 (R&D Cat# AF1924) 1:200; Mouse monoclonal anti-Oct4 (clone C-10) (Santa Cruz Cat# SC-5279) 1:200; Rabbit monoclonal Cdx2 (Abcam Cat# ab76541) 1:200; Goat Monoclonal Tfap2c (R&D Cat# AF5059) 1:200; Rabbit monoclonal Cytokeratin 7 (Abcam Cat# ab181598) 1:200; Rabbit monoclonal Cytokeratin 7 (Abcam Cat# ab68459) 1:200; Rabbit monoclonal Nanog (Abcam Cat# ab109250) 1:200; Mouse monoclonal Gata3 (Invitrogen Cat# MA1-028) 1:200; Goat polyclonal Gata3 (R&D Cat# AF2605) 1:200; Mouse monoclonal HCG-Beta (Abcam Cat# ab9582) 1:200; Rabbit monoclonal Gata6 (Cell signaling Cat# 5951) 1:200;
Techniques: Immunofluorescence
Journal: bioRxiv
Article Title: Transgene-Free Ex Utero Derivation of A Human Post-Implantation Embryo Model Solely from Genetically Unmodified Naïve PSCs
doi: 10.1101/2023.06.14.544922
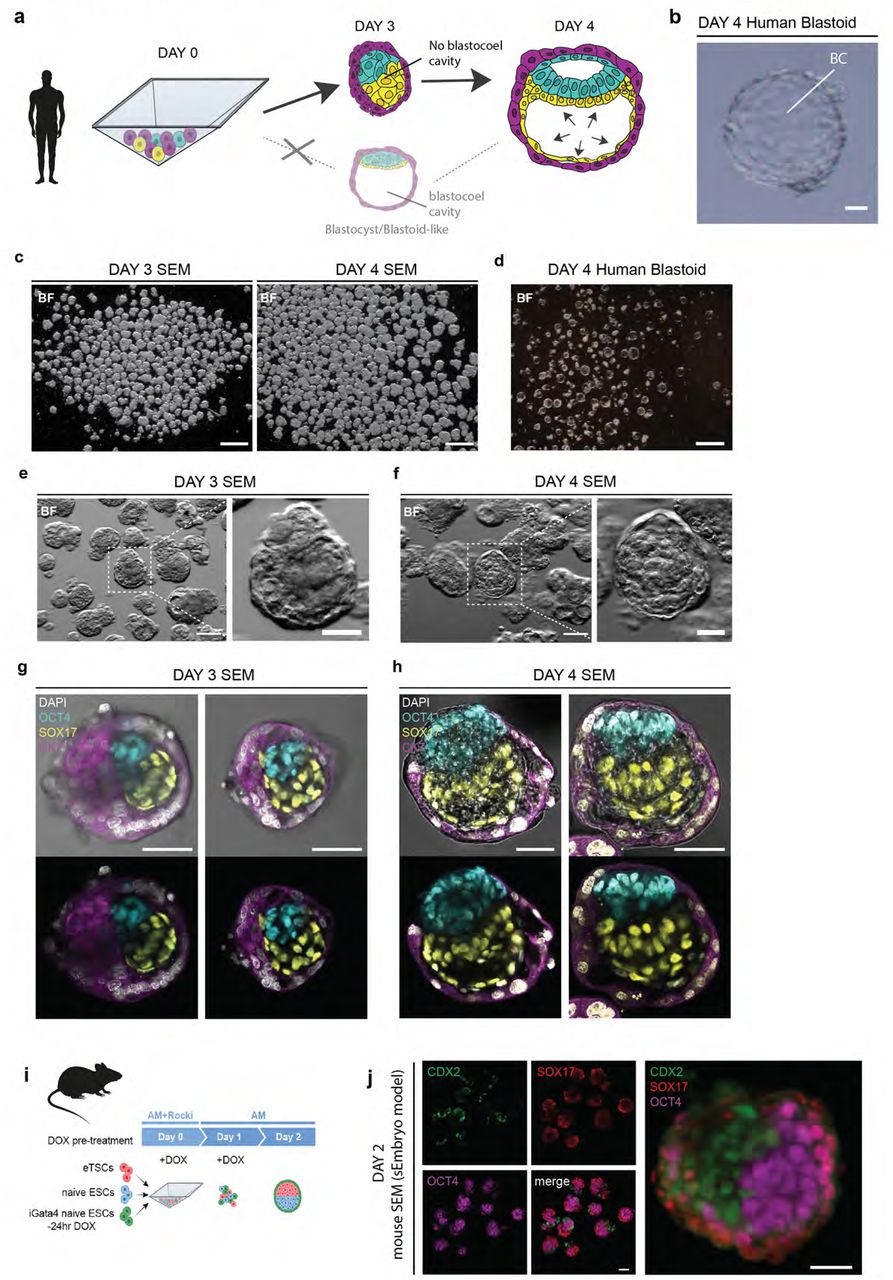
Figure Lengend Snippet: a, scheme showing the distinction between human SEM (top) and human blastoid (bottom) aggregation protocols: as opposed to blastoids, SEMs do not form a blastocoel cavity. Epiblast (cyan), hypoblast (yellow), trophoblast (magenta). b , representative brightfield image of a blastoid with blastocoel cavity (BC). Scale bar, 100 µm. c , representative examples of brightfield images of day 3 and day 4 SEMs showing no blastocoel cavity. Scale bar, 200 µm. d , brightfield images of day 4 human blastoids with a BC cavity. Scale bar, 200 µm. e-f , enlarged brightfield (BF) images of the SEMs showing no blastocoel cavity at day 3 or day 4 human SEMs (f). Scale bar, 100 µm; zoom in, 50 µm. g-h , brightfield and immunofluorescence images of day 3 (g) and day 4 (h) human SEMs showing developmental progression of epiblast (OCT4, cyan), hypoblast (SOX17, yellow), and trophoblast (CK7, magenta); nuclei (DAPI, white). Scale bars, 50 µm i , scheme showing mouse SEM (also known as sEmbryo) aggregation with murine stem cells as described in . j , immunofluorescence images showing epiblast (OCT4, magenta), hypoblast (SOX17, red), and trophectoderm (CDX2, green); Like human SEMs, mouse SEMs (sEmbryo models) do not form a BC. Notably mouse SEMs are predominantly surrounded by the PrE, rather than TE by Day 2 of the protocol. Scale bars, 50 µm; zoom in, 20 µm.
Article Snippet: The antibodies and dilutions employed for cell immunofluorescence were the following: Rabbit polyclonal anti-Cdx2 (Cell Signaling Cat# 3977) 1:200; Mouse monoclonal anti-Cdx2 (Biogenex Cat# MU392A-UC) 1:200; Rabbit polyclonal anti Gata4 (Abcam Cat# Ab84593) 1:120; Rabbit monoclonal anti-Foxa2 (Abcam Cat# Ab108422) 1:100; Goat polyclonal anti-Sox17 (R&D Cat# AF1924) 1:200; Mouse monoclonal anti-Oct4 (clone C-10) (Santa Cruz Cat# SC-5279) 1:200; Rabbit monoclonal Cdx2 (Abcam Cat# ab76541) 1:200; Goat Monoclonal Tfap2c (R&D Cat# AF5059) 1:200; Rabbit monoclonal Cytokeratin 7 (Abcam Cat# ab181598) 1:200; Rabbit monoclonal Cytokeratin 7 (Abcam Cat# ab68459) 1:200; Rabbit monoclonal Nanog (Abcam Cat# ab109250) 1:200; Mouse monoclonal Gata3 (Invitrogen Cat# MA1-028) 1:200; Goat polyclonal Gata3 (R&D Cat# AF2605) 1:200; Mouse monoclonal HCG-Beta (Abcam Cat# ab9582) 1:200; Rabbit monoclonal Gata6 (Cell signaling Cat# 5951) 1:200;
Techniques: Immunofluorescence

Journal: bioRxiv
Article Title: Transgene-Free Ex Utero Derivation of A Human Post-Implantation Embryo Model Solely from Genetically Unmodified Naïve PSCs
doi: 10.1101/2023.06.14.544922
Figure Lengend Snippet: a , individual Z-planes of the 3D immunofluorescence image of day 8 human SEM. Epiblast (OCT4, cyan), hypoblast (SOX17, yellow), and trophoblast (CK7, magenta); nuclei (DAPI, white). AC, amniotic cavity; Am, amnion; ExEM, extraembryonic mesoderm; SYS, secondary yolk sac; ChC, chorionic cavity; STB, syncytiotrophoblast. Z-step, 20 µm; scale bar, 50 µm. See also Video S1 .
Article Snippet: The antibodies and dilutions employed for cell immunofluorescence were the following: Rabbit polyclonal anti-Cdx2 (Cell Signaling Cat# 3977) 1:200; Mouse monoclonal anti-Cdx2 (Biogenex Cat# MU392A-UC) 1:200; Rabbit polyclonal anti Gata4 (Abcam Cat# Ab84593) 1:120; Rabbit monoclonal anti-Foxa2 (Abcam Cat# Ab108422) 1:100; Goat polyclonal anti-Sox17 (R&D Cat# AF1924) 1:200; Mouse monoclonal anti-Oct4 (clone C-10) (Santa Cruz Cat# SC-5279) 1:200; Rabbit monoclonal Cdx2 (Abcam Cat# ab76541) 1:200; Goat Monoclonal Tfap2c (R&D Cat# AF5059) 1:200; Rabbit monoclonal Cytokeratin 7 (Abcam Cat# ab181598) 1:200; Rabbit monoclonal Cytokeratin 7 (Abcam Cat# ab68459) 1:200; Rabbit monoclonal Nanog (Abcam Cat# ab109250) 1:200; Mouse monoclonal Gata3 (Invitrogen Cat# MA1-028) 1:200; Goat polyclonal Gata3 (R&D Cat# AF2605) 1:200; Mouse monoclonal HCG-Beta (Abcam Cat# ab9582) 1:200; Rabbit monoclonal Gata6 (Cell signaling Cat# 5951) 1:200;
Techniques: Immunofluorescence

Journal: bioRxiv
Article Title: Transgene-Free Ex Utero Derivation of A Human Post-Implantation Embryo Model Solely from Genetically Unmodified Naïve PSCs
doi: 10.1101/2023.06.14.544922
Figure Lengend Snippet: a, immunofluorescence images of naïve PSCs in HENSM medium, showing expression of OCT4 (cyan), DNMT3L (green, top), STELLA (green, middle), but not OTX2 (red). b , immunofluorescence images of Day 3 SEMs in N2B27 showing expression of OCT4 (cyan) and OTX2 (red), but not DNMT3L (green, top) or STELLA (green, middle). c , immunofluorescence images of SEMs developing from day 4 to day 8 showing epiblast (OCT4, cyan), hypoblast (SOX17 or GATA6, yellow), and trophoblast (CK7, SDC1 or GATA3, magenta). Right, zoom into the epiblast. Single- and double-asterisks mark proamniotic and amniotic cavities, respectively. d , quantification of epiblast growth by counting cell numbers in day 4, 6, and 8 SEMs. p-values, two-sided Mann-Whitney U-test. e , immunofluorescence images of day 6 SEMs showing apical cell markers: phospho-Ezrin/Radixin/Moesin (ph-ERM, red; top), Podocalaxyn (PODXL, red; bottom), and F-actin (green). f , immunofluorescence image, showing Anterior-Posterior (A-P) axis, marked by expression of T/BRA (red) and CER1 (green) on the opposite sides of the SEM in day 8. Right, zoom into the epiblast (OCT4, cyan). g , immunofluorescence image, showing amnion, marked by co-expression of TFAP2A (magenta) and ISL1(green) in SOX2-negative cells (cyan) of the day 8 SEM. Right, zoom into the epiblast region; arrows point at the amnion cells. h , immunofluorescence image, showing putative amnion in day 7 SEM, characterized by squamous OCT4-positive cells; OCT4 (cyan), DAPI (white). i , histological sections from the Carnegie collection of the human embryo at Carnegie Stage (CS) CS5c highlighting the start of amnion (Am) formation. j , immunofluorescence image, showing amnion in day 8 SEMs, characterized by squamous cells expressing TFAP2A (magenta), but not SOX2 (cyan); nuclei (DAPI, white). See also Video S2. k , histological sections taken from the Carnegie collection of the human embryo at Carnegie Stage (CS) CS6 highlighting amnion (Am) located dorsally to the bilaminar disk. l , immunofluorescence images (Z slices 22 and 26, top and bottom, respectively) of day 8 SEM, showing progenitor germ cells (PGCs) with co-expression of OCT4 (cyan), SOX17 (yellow), and BLIMP1 (red). Right, zoom into the individual PGCs, marked with arrows. Inset, brightfield image, embryo perimeter is outlined. Single- and double-asterisks mark proamniotic and amniotic cavities, respectively. Scale bars, 50 µm, 25 µm (e, right), 10 µm (l, right).
Article Snippet: The antibodies and dilutions employed for cell immunofluorescence were the following: Rabbit polyclonal anti-Cdx2 (Cell Signaling Cat# 3977) 1:200; Mouse monoclonal anti-Cdx2 (Biogenex Cat# MU392A-UC) 1:200; Rabbit polyclonal anti Gata4 (Abcam Cat# Ab84593) 1:120; Rabbit monoclonal anti-Foxa2 (Abcam Cat# Ab108422) 1:100; Goat polyclonal anti-Sox17 (R&D Cat# AF1924) 1:200; Mouse monoclonal anti-Oct4 (clone C-10) (Santa Cruz Cat# SC-5279) 1:200; Rabbit monoclonal Cdx2 (Abcam Cat# ab76541) 1:200; Goat Monoclonal Tfap2c (R&D Cat# AF5059) 1:200; Rabbit monoclonal Cytokeratin 7 (Abcam Cat# ab181598) 1:200; Rabbit monoclonal Cytokeratin 7 (Abcam Cat# ab68459) 1:200; Rabbit monoclonal Nanog (Abcam Cat# ab109250) 1:200; Mouse monoclonal Gata3 (Invitrogen Cat# MA1-028) 1:200; Goat polyclonal Gata3 (R&D Cat# AF2605) 1:200; Mouse monoclonal HCG-Beta (Abcam Cat# ab9582) 1:200; Rabbit monoclonal Gata6 (Cell signaling Cat# 5951) 1:200;
Techniques: Immunofluorescence, Expressing, MANN-WHITNEY

Journal: bioRxiv
Article Title: Transgene-Free Ex Utero Derivation of A Human Post-Implantation Embryo Model Solely from Genetically Unmodified Naïve PSCs
doi: 10.1101/2023.06.14.544922
Figure Lengend Snippet: a , immunofluorescence image of day 6 SEM showing aPKC (green), OCT4 (cyan), F-ACTIN (red), nuclei (DAPI, white). Scale bars, 50 µm, 12.5 µm (zoom in, right). b , left, immunofluorescence image of day 6 SEM showing OCT4 (cyan), F-ACTIN (red), and phERM (green); alignment of epi cells in a single 2D plane is marked with dashed lines; asterisk, pro-amniotic cavity. Scale bar, 25 µm. b , right, the angle between the epiblast cell axis and the pro-amniotic cavity was quantified; the plot shows the radial histogram of the angle values. The latter shows predominant alignment of epi cells towards the center of the emerging cavity. c , immunofluorescence image of day 6 SEM showing CER1 (green) localization inside the intracellular vesicles; OCT4 (cyan), nuclei (DAPI, white). Right, zoom into hypoblast, arrows mark apical side of the visceral endoderm cells with CER1 vesicles. Scale bar, 50 µm, 12.5 µm (4x zoom in, right). d , immunofluorescence image of day 6 SEM showing T/Bra expression (red); OCT4 (cyan), nuclei (DAPI, white). Right, zoom into the posterior epiblast, arrows mark individual T/Bra-positive cells. Scale bar, 50 µm, 12.5 µm (4x zoom in, right). e , immunofluorescence image of day 6 SEM showing F-ACTIN (white) and nuclei (DAPI, blue). Right, zoom into epiblast with squamous cells (sEpi) in the top and cylindrical/columnar cells (cEpi) in the bottom parts of the epiblast. Scale bar, 50 µm; zoom in, 25 µm. f , immunofluorescence image of day 6 SEM showing F-ACTIN (white) and OCT4 (cyan). Right, zoom into epiblast with squamous cells in the top and cylindrical cells in the bottom parts of the epiblast. Scale bar, 50 µm; zoom in, 25 µm. g , brightfield and immunofluorescence images of day 8 SEM showing NANOG (cyan), SOX17 (yellow), and nuclei (DAPI, white). Right, zoom onto PGCs in day 8 human SEMs, co-expressing NANOG and SOX17 (cells marked with arrows). Scale bars, 50 µm.
Article Snippet: The antibodies and dilutions employed for cell immunofluorescence were the following: Rabbit polyclonal anti-Cdx2 (Cell Signaling Cat# 3977) 1:200; Mouse monoclonal anti-Cdx2 (Biogenex Cat# MU392A-UC) 1:200; Rabbit polyclonal anti Gata4 (Abcam Cat# Ab84593) 1:120; Rabbit monoclonal anti-Foxa2 (Abcam Cat# Ab108422) 1:100; Goat polyclonal anti-Sox17 (R&D Cat# AF1924) 1:200; Mouse monoclonal anti-Oct4 (clone C-10) (Santa Cruz Cat# SC-5279) 1:200; Rabbit monoclonal Cdx2 (Abcam Cat# ab76541) 1:200; Goat Monoclonal Tfap2c (R&D Cat# AF5059) 1:200; Rabbit monoclonal Cytokeratin 7 (Abcam Cat# ab181598) 1:200; Rabbit monoclonal Cytokeratin 7 (Abcam Cat# ab68459) 1:200; Rabbit monoclonal Nanog (Abcam Cat# ab109250) 1:200; Mouse monoclonal Gata3 (Invitrogen Cat# MA1-028) 1:200; Goat polyclonal Gata3 (R&D Cat# AF2605) 1:200; Mouse monoclonal HCG-Beta (Abcam Cat# ab9582) 1:200; Rabbit monoclonal Gata6 (Cell signaling Cat# 5951) 1:200;
Techniques: Immunofluorescence, Expressing

Journal: bioRxiv
Article Title: Transgene-Free Ex Utero Derivation of A Human Post-Implantation Embryo Model Solely from Genetically Unmodified Naïve PSCs
doi: 10.1101/2023.06.14.544922
Figure Lengend Snippet: a , immunofluorescence image, showing yolk sac (YS) parietal (PE) and visceral (VE) endoderm (SOX17, yellow) in day 6 SEM. Nuclei (DAPI, blue), F-actin (white). Right, zoom into cuboidal VE and squamous PE cells. See also Video S4. b , quantification of cell aspect ratio (height/width) in VE (n = 14) and PE (n = 12) cells. c , Histological section taken from the Carnegie collection of the human embryo at Carnegie Stage 5c with a primitive yolk sac (PYS), cuboidal visceral endoderm (VE, top right), and squamous parietal endoderm (PE, bottom right). d , immunofluorescence images of day 6 SEMs showing epiblast (OCT4, cyan), hypoblast (SOX17, GATA6, yellow), and trophoblast (CK7, GATA3, magenta); nuclei (DAPI, white). Right, 2x zoom into the yolk sac (YS) region with extraembryonic mesoderm (ExEM). White arrows point at the VE and PE. e , immunofluorescence image of day 6 SEM showing formation of chorionic cavity (ChC) surrounded by ExEM (outlined) expressing GATA6 (red) and not SOX17 (yellow); nuclei (DAPI, white). Note lower expression levels of GATA6 in ExEM relative to YS cells. f , immunofluorescence image of day 6 SEM showing expression of BST2 in the cell membrane (red) in ExEM underneath the YS (SOX17, yellow); OCT4 (cyan), nuclei (DAPI, white). Right, zoom into the ExEM region. g , immunofluorescence image of day 8 SEM showing expression of VIM (red) in ExEM underneath the YS (SOX17, yellow); OCT4 (cyan), nuclei (DAPI, white). Right, zoom into the ExEM region. The boundaries between the YS, ExEM, and trophoblast (Tb) are outlined. See also Video S5 . h , schematic of the 14 dpf human embryo showing ExEM in grey; Am, amnion; Sk, stalk; SYS, secondary yolk sac. i , brightfield and immunofluorescence images of day 8 SEM in different Z slices (Z 42 and 67) showing FOXF1 (green), GATA6 (red), and OCT4 (cyan). Arrows point to epiblast (Epi), ChC, ExEM, YS, Sk, and a secondary yolk sac (SYS); scale bar, 100 µm. j , immunofluorescence image of day 8 SEM with a cavitated ExEM marked by BTS2 (white), and SYS; OCT4 (cyan), SOX17 (yellow). Red arrows point at the SOX17+ PYS cell remnants. See also sequential sections from the same SEM in . k , histological section taken from the Carnegie collection of the human embryo at Carnegie Stage 6 showing filamentous ExEM and the secondary yolk sac (SYS). Scale bars, 50 µm, 10 µm (zoom: a, c, f).
Article Snippet: The antibodies and dilutions employed for cell immunofluorescence were the following: Rabbit polyclonal anti-Cdx2 (Cell Signaling Cat# 3977) 1:200; Mouse monoclonal anti-Cdx2 (Biogenex Cat# MU392A-UC) 1:200; Rabbit polyclonal anti Gata4 (Abcam Cat# Ab84593) 1:120; Rabbit monoclonal anti-Foxa2 (Abcam Cat# Ab108422) 1:100; Goat polyclonal anti-Sox17 (R&D Cat# AF1924) 1:200; Mouse monoclonal anti-Oct4 (clone C-10) (Santa Cruz Cat# SC-5279) 1:200; Rabbit monoclonal Cdx2 (Abcam Cat# ab76541) 1:200; Goat Monoclonal Tfap2c (R&D Cat# AF5059) 1:200; Rabbit monoclonal Cytokeratin 7 (Abcam Cat# ab181598) 1:200; Rabbit monoclonal Cytokeratin 7 (Abcam Cat# ab68459) 1:200; Rabbit monoclonal Nanog (Abcam Cat# ab109250) 1:200; Mouse monoclonal Gata3 (Invitrogen Cat# MA1-028) 1:200; Goat polyclonal Gata3 (R&D Cat# AF2605) 1:200; Mouse monoclonal HCG-Beta (Abcam Cat# ab9582) 1:200; Rabbit monoclonal Gata6 (Cell signaling Cat# 5951) 1:200;
Techniques: Immunofluorescence, Expressing

Journal: bioRxiv
Article Title: Transgene-Free Ex Utero Derivation of A Human Post-Implantation Embryo Model Solely from Genetically Unmodified Naïve PSCs
doi: 10.1101/2023.06.14.544922
Figure Lengend Snippet: a , immunofluorescence image of day 6 SEM showing apical polarity of the visceral and parietal hypoblast (SOX17, yellow); aPKC (heat gradient), F-ACTIN (white). Scale bar, 50 µm; zoom in, 10 µm. See also Video S3 . b , immunofluorescence image of day 6 SEM showing mesenchymal-like cells underneath the yolk sac; OCT4 (cyan), F-ACTIN (red), and nuclei (DAPI, white). Right, zoom into the region underneath the yolk sac, shown in different Z-planes (number 50, 60, and 70). Arrows point at the cells between yolk sac and the trophoblast compartments. Scale bar, 50 µm; zoom in, 25 µm. See also Video S2. c , heatmap of GATA6 and SOX17 gene expression across extraembryonic tissues in marmoset, corresponding to the Carnegie stages (CS) 5-7), extracted from previously published study related gene expression dataset . Am, amnion; Tb, trophoblast; VE, visceral endoderm; SYS, secondary yolk sac; ExEM, extraembryonic mesoderm. d , immunofluorescence image of day 6 SEM showing OCT4 (cyan), GATA4 (red), SOX17 (yellow), and nuclei (DAPI). Right, zoom on ExEM cells expressing GATA4, but not SOX17. YS, yolk sac. Scale bar, 50 µm; zoom in, 10 µm. e, immunofluorescence images of day 6 SEMs showing chorionic cavity surrounded by ExEM (outlined), negative for SOX17 (yellow), but expressing BST2 (top, red) and GATA6 (bottom, red); OCT4 (cyan), nuclei (DAPI, white). Scale bar, 50 µm. f , left, immunofluorescence image of Z slice from day 8 SEM and the zoom into the ExEM region showing VIM (red) expression and nuclei (DAPI, white). Right, merged brightfield and maximum intensity projection showing VIM (red) expression. Scale bar, 50 µm; zoom in, 10 µm.
Article Snippet: The antibodies and dilutions employed for cell immunofluorescence were the following: Rabbit polyclonal anti-Cdx2 (Cell Signaling Cat# 3977) 1:200; Mouse monoclonal anti-Cdx2 (Biogenex Cat# MU392A-UC) 1:200; Rabbit polyclonal anti Gata4 (Abcam Cat# Ab84593) 1:120; Rabbit monoclonal anti-Foxa2 (Abcam Cat# Ab108422) 1:100; Goat polyclonal anti-Sox17 (R&D Cat# AF1924) 1:200; Mouse monoclonal anti-Oct4 (clone C-10) (Santa Cruz Cat# SC-5279) 1:200; Rabbit monoclonal Cdx2 (Abcam Cat# ab76541) 1:200; Goat Monoclonal Tfap2c (R&D Cat# AF5059) 1:200; Rabbit monoclonal Cytokeratin 7 (Abcam Cat# ab181598) 1:200; Rabbit monoclonal Cytokeratin 7 (Abcam Cat# ab68459) 1:200; Rabbit monoclonal Nanog (Abcam Cat# ab109250) 1:200; Mouse monoclonal Gata3 (Invitrogen Cat# MA1-028) 1:200; Goat polyclonal Gata3 (R&D Cat# AF2605) 1:200; Mouse monoclonal HCG-Beta (Abcam Cat# ab9582) 1:200; Rabbit monoclonal Gata6 (Cell signaling Cat# 5951) 1:200;
Techniques: Immunofluorescence, Expressing

Journal: bioRxiv
Article Title: Transgene-Free Ex Utero Derivation of A Human Post-Implantation Embryo Model Solely from Genetically Unmodified Naïve PSCs
doi: 10.1101/2023.06.14.544922
Figure Lengend Snippet: a , individual Z-planes of the 3D immunofluorescence image of day 8 human SEM showing OCT4 (cyan), SOX17 (yellow), and BST2 (white). Epi, epiblast; YS, yolk sac; ExEM, extraembryonic mesoderm; SYS, secondary yolk sac; Z-step, 20 µm; scale bar, 50 µm.
Article Snippet: The antibodies and dilutions employed for cell immunofluorescence were the following: Rabbit polyclonal anti-Cdx2 (Cell Signaling Cat# 3977) 1:200; Mouse monoclonal anti-Cdx2 (Biogenex Cat# MU392A-UC) 1:200; Rabbit polyclonal anti Gata4 (Abcam Cat# Ab84593) 1:120; Rabbit monoclonal anti-Foxa2 (Abcam Cat# Ab108422) 1:100; Goat polyclonal anti-Sox17 (R&D Cat# AF1924) 1:200; Mouse monoclonal anti-Oct4 (clone C-10) (Santa Cruz Cat# SC-5279) 1:200; Rabbit monoclonal Cdx2 (Abcam Cat# ab76541) 1:200; Goat Monoclonal Tfap2c (R&D Cat# AF5059) 1:200; Rabbit monoclonal Cytokeratin 7 (Abcam Cat# ab181598) 1:200; Rabbit monoclonal Cytokeratin 7 (Abcam Cat# ab68459) 1:200; Rabbit monoclonal Nanog (Abcam Cat# ab109250) 1:200; Mouse monoclonal Gata3 (Invitrogen Cat# MA1-028) 1:200; Goat polyclonal Gata3 (R&D Cat# AF2605) 1:200; Mouse monoclonal HCG-Beta (Abcam Cat# ab9582) 1:200; Rabbit monoclonal Gata6 (Cell signaling Cat# 5951) 1:200;
Techniques: Immunofluorescence

Journal: bioRxiv
Article Title: Transgene-Free Ex Utero Derivation of A Human Post-Implantation Embryo Model Solely from Genetically Unmodified Naïve PSCs
doi: 10.1101/2023.06.14.544922
Figure Lengend Snippet: a, top, immunofluorescence images of day 6 SEMs showing epiblast (OCT4, cyan), hypoblast (SOX17 or GATA6, yellow), and trophoblast (GATA3, CK7 or SDC1, magenta). Bottom, single-channel images of the trophoblast, surrounding the SEMs. b , scheme of the 11-12 dpf human embryo showing multinucleated syncytiotrophoblast (magenta) with lacunae. c , left, maximum intensity projection image of day 6 SEMs showing HCGB expression in the outer cells; F-ACTIN (red). Right, immunofluorescence image of the same SEM showing intracellular lacunae (marked with asterisks) inside the outer syncytiotrophoblast cell layer; nuclei (DAPI, white). d , histological section and 3D reconstruction (top right) from the Carnegie collection of a human embryo at Carnegie Stage (CS) 5c, showing lacunae in the syncytiotrophoblast (asterisks). e , brightfield and immunofluorescence images of two different Z planes (number 3 and 11, top and bottom panels, respectively) of day 6 SEMs showing epiblast (OCT4, cyan), hypoblast (SOX17, or GATA6, yellow), and trophoblast (SDC1, magenta). Top row - Lacunae are outlined and marked with asterisks. Right, zoom into the lacunae (top). Bottom row - the outer syncytiotrophoblast layer (bottom), its thickness is marked with brackets. f , immunofluorescence image of day 6 SEM showing CK7 (magenta), F-ACTIN (red), and nuclei (DAPI, white). Bottom, zoom into the multinucleated syncytiotrophoblast cell; arrows point at multiple nuclei inside the single cell. Scale bars, 50 µm, 10 µm (e, zoom).
Article Snippet: The antibodies and dilutions employed for cell immunofluorescence were the following: Rabbit polyclonal anti-Cdx2 (Cell Signaling Cat# 3977) 1:200; Mouse monoclonal anti-Cdx2 (Biogenex Cat# MU392A-UC) 1:200; Rabbit polyclonal anti Gata4 (Abcam Cat# Ab84593) 1:120; Rabbit monoclonal anti-Foxa2 (Abcam Cat# Ab108422) 1:100; Goat polyclonal anti-Sox17 (R&D Cat# AF1924) 1:200; Mouse monoclonal anti-Oct4 (clone C-10) (Santa Cruz Cat# SC-5279) 1:200; Rabbit monoclonal Cdx2 (Abcam Cat# ab76541) 1:200; Goat Monoclonal Tfap2c (R&D Cat# AF5059) 1:200; Rabbit monoclonal Cytokeratin 7 (Abcam Cat# ab181598) 1:200; Rabbit monoclonal Cytokeratin 7 (Abcam Cat# ab68459) 1:200; Rabbit monoclonal Nanog (Abcam Cat# ab109250) 1:200; Mouse monoclonal Gata3 (Invitrogen Cat# MA1-028) 1:200; Goat polyclonal Gata3 (R&D Cat# AF2605) 1:200; Mouse monoclonal HCG-Beta (Abcam Cat# ab9582) 1:200; Rabbit monoclonal Gata6 (Cell signaling Cat# 5951) 1:200;
Techniques: Immunofluorescence, Expressing

Journal: bioRxiv
Article Title: Transgene-Free Ex Utero Derivation of A Human Post-Implantation Embryo Model Solely from Genetically Unmodified Naïve PSCs
doi: 10.1101/2023.06.14.544922
Figure Lengend Snippet: a , brightfield image overlayed with the immunofluorescence of day 8 SEM showing the outer trophoblast (CK7, magenta) surrounding the entire SEM. Right, zoom into the multinucleated trophoblast layer. Scale bars, 50 µm. b , the maximum intensity projection (Maxi. Proj.) of the immunofluorescence image of day 8 SEM showing trophoblast (GATA3, magenta) and nuclei, (DAPI, white). Scale bar, 50 µm. c , quantification of the percentage SEMs surrounded by trophoblast lineage (generated from WT naïve PSCs following 3 day BAP(J) protocol), as judged by the expression of SDC1, CK7, and GATA3 of day 6, across two independent experimental replicates. The total number of SEMs used for quantification are: SD1 (n1=525 and n2=769); CK7 (n1=299 and n2=466) and GATA3 (n1=150 and n2=337). d , representative immunofluorescence images of multiple day 6 SEMs showing epiblast (OCT4, cyan), hypoblast (SOX17 and GATA6, yellow), and trophoblast (SDC1 and GATA3, magenta) surrounding the SEMs; nuclei (DAPI, white), that were used for calculation presented in ( c ). Scale bar, 200 µm. e , immunofluorescence image of day 6 SEM showing HCGB (green) and CK7 (magenta) staining. HCGB positive syncytiotrophoblast cells (right, zoom) are highlighted. nuclei (DAPI, white), F-actin (white, right zoom). Arrows point at the outer syncytiotrophoblast cell surface. Scale bars, 50 µm. f , immunofluorescence image of a human SEM showing multinucleated HCGB-positive syncytiotrophoblast; HCGB (green), F-ACTIN (red), nuclei (DAPI, white). Arrows point at multiple nuclei inside the same single cell as validated following F-actin staining. Scale bars, 50 µm. g , pregnancy test run on spent medium of the day 8 SEMs (Day 8-right) compared to unspent medium as a negative control (CTR-left) which shows the secretion of HCGB from the syncytiotrophoblast of day7-8 human SEM to the culture medium.
Article Snippet: The antibodies and dilutions employed for cell immunofluorescence were the following: Rabbit polyclonal anti-Cdx2 (Cell Signaling Cat# 3977) 1:200; Mouse monoclonal anti-Cdx2 (Biogenex Cat# MU392A-UC) 1:200; Rabbit polyclonal anti Gata4 (Abcam Cat# Ab84593) 1:120; Rabbit monoclonal anti-Foxa2 (Abcam Cat# Ab108422) 1:100; Goat polyclonal anti-Sox17 (R&D Cat# AF1924) 1:200; Mouse monoclonal anti-Oct4 (clone C-10) (Santa Cruz Cat# SC-5279) 1:200; Rabbit monoclonal Cdx2 (Abcam Cat# ab76541) 1:200; Goat Monoclonal Tfap2c (R&D Cat# AF5059) 1:200; Rabbit monoclonal Cytokeratin 7 (Abcam Cat# ab181598) 1:200; Rabbit monoclonal Cytokeratin 7 (Abcam Cat# ab68459) 1:200; Rabbit monoclonal Nanog (Abcam Cat# ab109250) 1:200; Mouse monoclonal Gata3 (Invitrogen Cat# MA1-028) 1:200; Goat polyclonal Gata3 (R&D Cat# AF2605) 1:200; Mouse monoclonal HCG-Beta (Abcam Cat# ab9582) 1:200; Rabbit monoclonal Gata6 (Cell signaling Cat# 5951) 1:200;
Techniques: Immunofluorescence, Generated, Expressing, Staining, Pregnancy Test (hCG) Assay, Negative Control

Journal: bioRxiv
Article Title: Transgene-Free Ex Utero Derivation of A Human Post-Implantation Embryo Model Solely from Genetically Unmodified Naïve PSCs
doi: 10.1101/2023.06.14.544922
Figure Lengend Snippet: a , UMAP plot displaying individual human SEM derived cells. Points are colored according to their assigned cell cluster. All 13 clusters representing multiple cell types were identified based on known marker genes and overlap with gene signatures, as indicated. ExEM: Extra-embryonic Mesoderm; YS: Yolk-Sac; Hb: Hypoblast; SYS: Secondary Yolk Sac; Am: Amnion; Tb: Trophoblast. b , Normalized expression of key marker genes projected on SEM UMAP. Cell type cluster highlighted is indicated in red, along with the corresponding cluster number. c , Dot-plot illustrating the expression of key marker genes across the 13 clusters. Cell types as in (A) and (B). Color shade indicates average expression. Dot size indicates the percentage of cells in the cluster which express the marker highlighted. d , left: POU5F1+PRDM1+SOX17+ cells (n=27) can be identified in Epi clusters, with majority located in cluster 4 (n=19). Right: Normalized expression heatmap of PGC markers (SOX17, PRDM1, NANOS3, NANOG, POU5F1). 9 cells were positive for POU5F1, PRDM1, SOX17 and NANOS3, again confirming their identity as human PGCs. e , Left: UMAP projection of integrated human embryonic reference consisting of 5 human embryonic data sets spanning in vitro cultured human blastocysts , , , 3D-in vitro cultured human blastocysts until pre-gastrulation stages , and a Carnegie Stage 7 (CS7) 16-19dpf human gastrula . The color of each data point corresponds to the cell annotations retrieved from the respective publication. Right: The grey data points represent embryonic reference cells, as in the left panel. Each colored triangle represents the projection position of representing neighborhood nodes from SEM cells onto the human embryonic reference UMAP space.
Article Snippet: The antibodies and dilutions employed for cell immunofluorescence were the following: Rabbit polyclonal anti-Cdx2 (Cell Signaling Cat# 3977) 1:200; Mouse monoclonal anti-Cdx2 (Biogenex Cat# MU392A-UC) 1:200; Rabbit polyclonal anti Gata4 (Abcam Cat# Ab84593) 1:120; Rabbit monoclonal anti-Foxa2 (Abcam Cat# Ab108422) 1:100; Goat polyclonal anti-Sox17 (R&D Cat# AF1924) 1:200; Mouse monoclonal anti-Oct4 (clone C-10) (Santa Cruz Cat# SC-5279) 1:200; Rabbit monoclonal Cdx2 (Abcam Cat# ab76541) 1:200; Goat Monoclonal Tfap2c (R&D Cat# AF5059) 1:200; Rabbit monoclonal Cytokeratin 7 (Abcam Cat# ab181598) 1:200; Rabbit monoclonal Cytokeratin 7 (Abcam Cat# ab68459) 1:200; Rabbit monoclonal Nanog (Abcam Cat# ab109250) 1:200; Mouse monoclonal Gata3 (Invitrogen Cat# MA1-028) 1:200; Goat polyclonal Gata3 (R&D Cat# AF2605) 1:200; Mouse monoclonal HCG-Beta (Abcam Cat# ab9582) 1:200; Rabbit monoclonal Gata6 (Cell signaling Cat# 5951) 1:200;
Techniques: Derivative Assay, Marker, Expressing, In Vitro, Cell Culture

Journal: bioRxiv
Article Title: Transgene-Free Ex Utero Derivation of A Human Post-Implantation Embryo Model Solely from Genetically Unmodified Naïve PSCs
doi: 10.1101/2023.06.14.544922
Figure Lengend Snippet: a, UMAP of the four annotated epiblast clusters (1,4,7 & 11) alongside normalized expression of key marker genes. From the four Epi clusters we subclassified 2 of them. The first we termed Posterior epiblast cluster (#4) was marked by upregulation of TBXT (Brachyury), MIXL1, EOMES, MESP1 and WNT8a which are markers of EMT. The second we termed as “committed epiblast” cluster (#7) and was marked by ZIC2, ZEB2, VIM lineage commitment marker expression and absence of NANOG while maintaining OCT4 and SOX2 expression. b , Normalized expression of key trophoblast marker genes projected on SEM UMAP. Trophoblast (Tb) cluster (number 12) is highlighted in red. c , Normalized expression of key amnion marker genes projected on human SEM related UMAP. Amnion cluster (number 10) is highlighted in red. d , Expression of BMP4 and/or FURIN in Amnion (Am) and Trophoblast (Tb) clusters.
Article Snippet: The antibodies and dilutions employed for cell immunofluorescence were the following: Rabbit polyclonal anti-Cdx2 (Cell Signaling Cat# 3977) 1:200; Mouse monoclonal anti-Cdx2 (Biogenex Cat# MU392A-UC) 1:200; Rabbit polyclonal anti Gata4 (Abcam Cat# Ab84593) 1:120; Rabbit monoclonal anti-Foxa2 (Abcam Cat# Ab108422) 1:100; Goat polyclonal anti-Sox17 (R&D Cat# AF1924) 1:200; Mouse monoclonal anti-Oct4 (clone C-10) (Santa Cruz Cat# SC-5279) 1:200; Rabbit monoclonal Cdx2 (Abcam Cat# ab76541) 1:200; Goat Monoclonal Tfap2c (R&D Cat# AF5059) 1:200; Rabbit monoclonal Cytokeratin 7 (Abcam Cat# ab181598) 1:200; Rabbit monoclonal Cytokeratin 7 (Abcam Cat# ab68459) 1:200; Rabbit monoclonal Nanog (Abcam Cat# ab109250) 1:200; Mouse monoclonal Gata3 (Invitrogen Cat# MA1-028) 1:200; Goat polyclonal Gata3 (R&D Cat# AF2605) 1:200; Mouse monoclonal HCG-Beta (Abcam Cat# ab9582) 1:200; Rabbit monoclonal Gata6 (Cell signaling Cat# 5951) 1:200;
Techniques: Expressing, Marker
Journal: Stem cell research & therapy
Article Title: Footprint-free induced pluripotent stem cells can be successfully differentiated into mesenchymal stromal cells in the feline model.
doi: 10.1186/s13287-025-04325-2
Figure Lengend Snippet: Fig. 2 Feline iPSCs express pluripotent characteristics, pluripotency markers, and silencing of exogenous transgenes. (A). Characteristic morphology of established iPSC colonies after being passaged onto feeder cells. Arrows indicate cells with a high nuclear-to-cytoplasmic ratios. (B & C). Conventional RT-PCR analysis of endogenously expressed feline pluripotency markers SOX2, NANOG and OCT4, and the loading control GAPDH, in feline iPSCs at pas sage (P) 0, 3, 6, 9 and 12 (B) and P15 and 25 (C). Full-length gels are presented in Additional File 9: Fig. 9). (D). Conventional RT-PCR analysis of human exogenous transcription factors c-Myc, KOS, KLF4, and Sendai virus (SV), in feline iPSCs at P 0, 3, 6, 9 and 12. Feline GAPDH was included as loading control. (E). Expression of SeV using qPCR analysis at different passages
Article Snippet: Generation of feline iPSCs using retroviral (RV) vectors Retroviral plasmids based on the Moloney murine leukemia virus (MMLV) were purchased from Addgene and contained the coding sequences for the human transcription factors:
Techniques: Reverse Transcription Polymerase Chain Reaction, Control, Virus, Expressing

Journal: Stem cell research & therapy
Article Title: Footprint-free induced pluripotent stem cells can be successfully differentiated into mesenchymal stromal cells in the feline model.
doi: 10.1186/s13287-025-04325-2
Figure Lengend Snippet: Fig. 3 Alkaline phosphatase staining, karyotype analysis, and embryoid body (EB) formation assay. (A). Feline iPSC colonies were stained for alkaline phos phatase or left unstained (control). (B). Karyotype analysis of feline iPSCs-1 and iPSCs − 2 at P20 showing a normal diploid chromosome number of 38. (C). Feline iPSCs formed embryoid bodies (EBs) in suspension culture in differentiation medium. (D). Conventional RT-PCR analysis of feline markers of all three embryonic germ layers, including alpha-fetoprotein (AFP), GATA binding protein 6 (GATA6), and C-X-C chemokine receptor type 4 (CXCR4) for endoderm; smooth muscle actin (SMA) and GATA2 for mesoderm; and ENOLASE and NESTIN for ectoderm in feline EBs. Feline GAPDH was included as loading control. Full-length gels are presented in Additional File 10: Fig. S10. (E). Conventional RT-PCR analysis of endogenously expressed feline pluripotency markers OCT4, SOX2, and NANOG, and the loading control GAPDH, in feline iPSCs and EBs
Article Snippet: Generation of feline iPSCs using retroviral (RV) vectors Retroviral plasmids based on the Moloney murine leukemia virus (MMLV) were purchased from Addgene and contained the coding sequences for the human transcription factors:
Techniques: Staining, Tube Formation Assay, Control, Suspension, Reverse Transcription Polymerase Chain Reaction, Binding Assay
Journal: Molecular Therapy. Methods & Clinical Development
Article Title: Establishment of SLC15A1/PEPT1-Knockout Human-Induced Pluripotent Stem Cell Line for Intestinal Drug Absorption Studies
doi: 10.1016/j.omtm.2019.11.008
Figure Lengend Snippet: Generation of PEPT1-KO Human iPSCs (A) The schematic overview shows the targeting strategy for PEPT1/SLC15A1 . The PCR primers that can distinguish WT and mutant alleles are shown with red arrows. Donor plasmid: EF1α, elongation factor 1 alpha promoter; PuroR, puromycin resistant protein; pA, polyadenylation sequence; HDR, homology-directed repair. (B) The genotyping was performed in the PEPT1/SLC15A1 locus. (C) Sequencing analyses were performed to examine whether the PEPT1/SLC15A1-KO iPSC clone was correctly targeted. To confirm the DNA sequence, the PCR products were purified and subjected to sequencing analyses. The single-guide RNA (sgRNA)-targeting sequences are shown in red. (D) The gene expression levels of POU5F1 , NANOG , and SOX2 in WT-iPSCs and PEPT1-KO iPSCs were examined by real-time RT-PCR analysis. The gene expression levels in the WT-iPSCs (WT) were taken as 1.0. Data represent the means ± SD (n = 8, technical replicate). (E) Immunostaining analysis of POU5F1 (red) was performed in the WT-iPSCs and PEPT1/SLC15A1-KO cells. Nuclei were stained with DAPI (blue). Scale bars represent 50 μm.
Article Snippet: To perform the immunocytochemistry, the human iPSCs and their derivatives were fixed with 4% paraformaldehyde (FUJIFILM Wako) in PBS for 10 min. After blocking the cells with PBS containing 2% BSA and 0.2% Triton X-100 for 20 min, the cells were incubated with the
Techniques: Mutagenesis, Plasmid Preparation, Sequencing, Purification, Gene Expression, Quantitative RT-PCR, Immunostaining, Staining
Journal: medRxiv
Article Title: Investigating the pathogenicity of the recessive HNF1A p.A251T variant in monogenic diabetes using iPSC-derived beta-like cells
doi: 10.1101/2024.12.10.24318788
Figure Lengend Snippet: Reprogramming and characterisation of iPSC carrying p.A251T HNF1A variant . A: Overview of the iPSC reprogramming protocol. Somatic fibroblasts were transfected with episomal reprogramming vectors at day 4. After transfection, cells were cultured in N2B27 media with bFGF for 14 days. Media was then switched to stem cell conditions, and colonies were picked around day 21 for further analysis. B: Confocal microscopy images showing OCT4 expression in reprogrammed iPSC colonies. Cells were stained with DAPI (blue, 405 nm) to label nuclei and OCT4 (green, 488 nm) to assess pluripotency. Imaging was performed using the Leica Stellaris 8 Confocal Microscope. Co-localisation of DAPI and OCT4 indicates pluripotency. C: Quantification of OCT4-positive cells. OCT4-positive cells were identified by co-localisation with DAPI and quantified using an automated macro. The graph shows the percentage of OCT4-positive cells relative to total cells in the colonies. D: Morphological changes during the differentiation process observed under brightfield microscopy. Day 1: Fibroblast-like cells (top left). Day 12: Intermediate cell morphology (top right). Day 15: iPSC-like colony formation. Day 18: Growth phase, ready for picking. Arrows indicate changes in cell morphology over time. Scale bar = 100 µm. E: Karyotyping analysis of selected iPSC clones. G-banding of chromosomes revealed a normal karyotype with 46 chromosomes, including two X chromosomes, consistent with the donor’s female sex.
Article Snippet: A minimum of 3×10 6 fibroblast cells were electroporated (1650V, 10ms, 3 pulses) with 3ug of three 3 reprogramming plasmids containing the
Techniques: Variant Assay, Transfection, Cell Culture, Confocal Microscopy, Expressing, Staining, Imaging, Microscopy, Clone Assay